Introduction to Prometheus and Grafana
23 Jan 2022
In this article, I explore the difference between logging and monitoring, expanding my knowledge and understanding of Prometheus, a popular time series metric collector and storage application with Kubernetes integration. I learn how to quickly deploy this alongside Grafana, a popular dashboard application, on my Proxmox server in a container. Lastly, I briefly cover how to import the node exporter full dashboard to visually display our collected metrics.
Logging and Monitoring
Logging is the qualitative data, its related to the state or an event of an application or service. Whereas Monitoring (Time Series, Metric data) is the quantitative data, it relates to data about the rate of change.
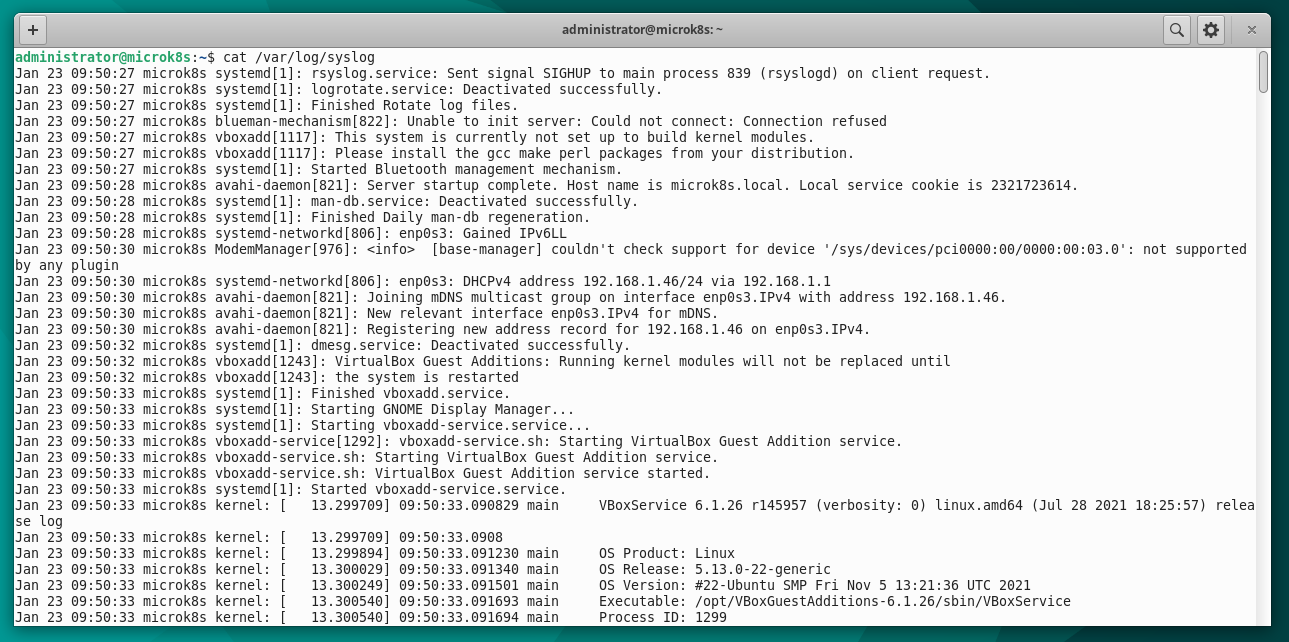
An example of logging is to look at in Linux the syslog file cat /var/log/syslog.
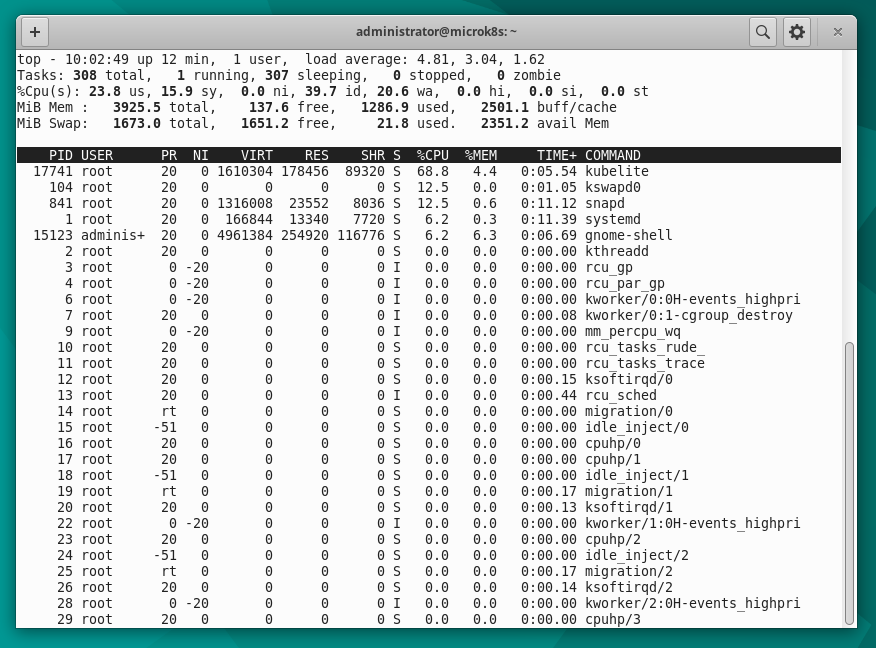
An example of monitoring in Linux is to use the top command.
Prometheus
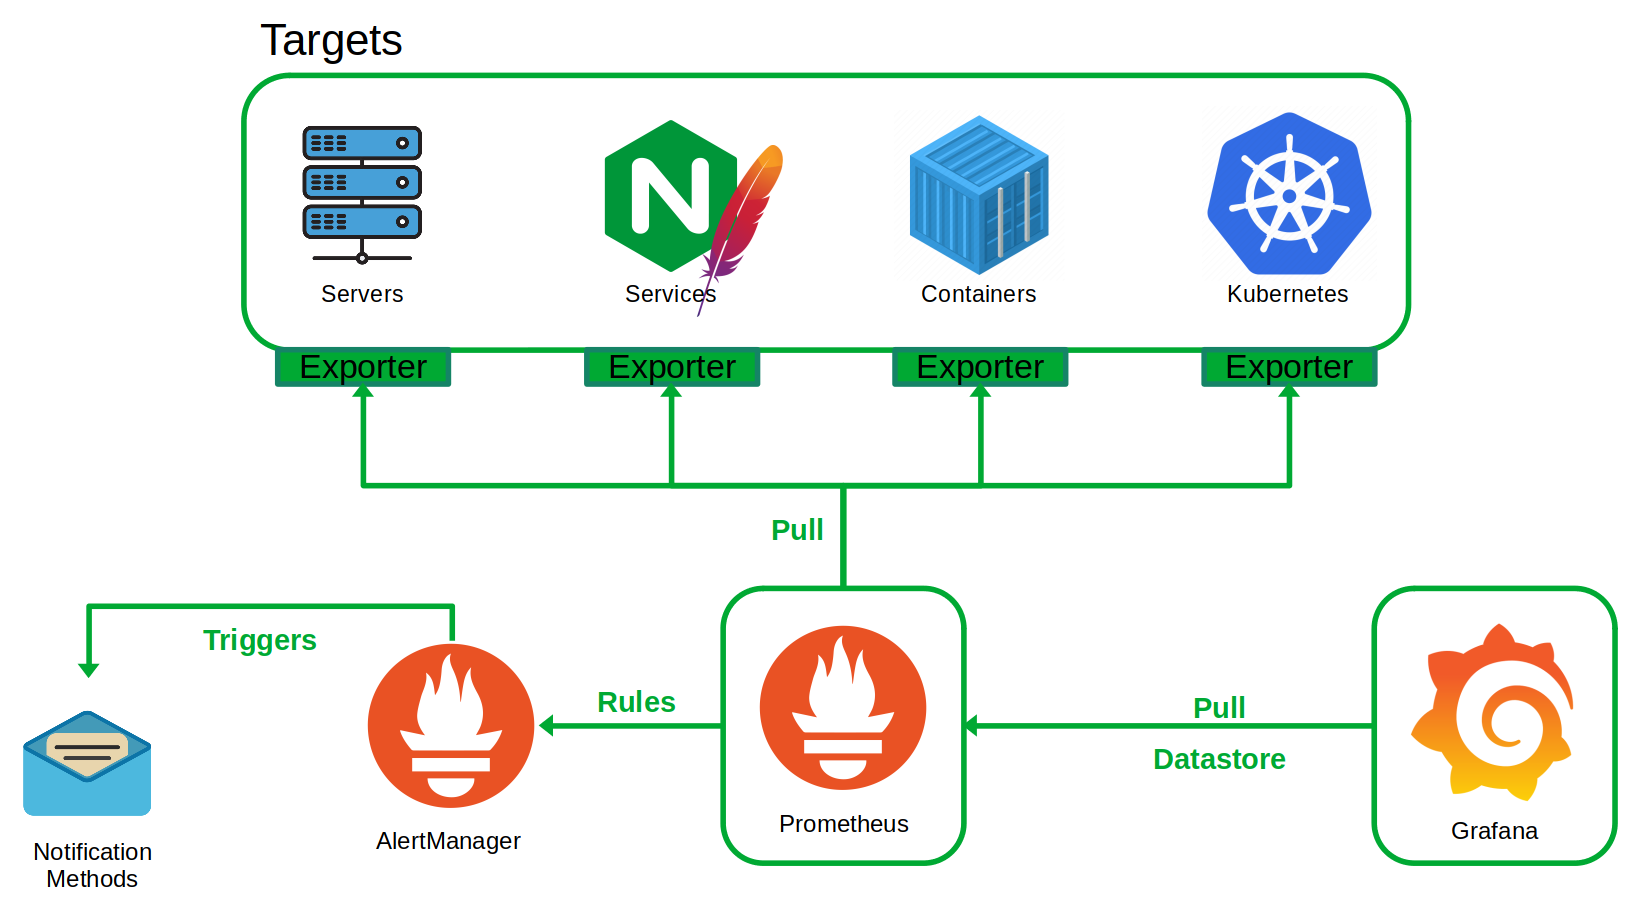
Prometheus is pull-based and time series, used in a generic environment with Kubernetes integration. Prometheus captures and stores metrics and has an alerting capability using “AlertManager”.
Prometheus is built to be reliable, standalone and self-containing, this ensures that the service continues to run even when other elements of the network are broken. Prometheus can also be installed within a Kubernetes cluster.
Prometheus Server Components
- Retrieval - Data Retrieval Worker
- Storage - Time Series Database
- HTTP Server - Accepts PromQL queries
Prometheus monitors targets, which contain metrics. Metrics are collected by pulling from HTTP requests such as http://{hostname}/metrics.
If metrics cannot be collected directly, Prometheus Exporters can be installed on targets to convert metrics to data that is understandable by Prometheus and also expose them to the Prometheus server.
Prometheus comes with a WebUI where queries can be executed and graphed on a per query basis. Grafana is a popular Dashboard application to create visual dashboards using the metrics collected by Prometheus.
Installation of Prometheus and Grafana
In this demonstration I will be installing Prometheus and Grafana on two different Ubuntu LXC containers using Proxmox, although both services can also be setup using Docker.
Prometheus
Update and Upgrade the server
sudo apt update && sudo apt upgrade -y
Install the Prometheus server
sudo apt install -y prometheus prometheus-alertmanager
Check status of service and find the server IP address
systemctl status prometheus

ip addr
Visit IP address of server using port 9090
http://192.168.1.x:9090
Granfana OSS
OSS stands for Open-Source Source. Grafana is available in OSS or Enterprise editions.
Update and Upgrade the server
sudo apt update && sudo apt upgrade -y
Install Grafana from APT repository
sudo apt-get install -y apt-transport-https
sudo apt-get install -y software-properties-common wget
wget -q -O - https://packages.grafana.com/gpg.key | sudo apt-key add -
For stable repository
echo "deb https://packages.grafana.com/oss/deb stable main" | sudo tee -a /etc/apt/sources.list.d/grafana.list
Update repositories and Install Grafana
sudo apt-get update
sudo apt-get install -y grafana
Start and Check Grafana Service
sudo systemctl daemon-reload
sudo systemctl start grafana-server
systemctl status grafana-server
Start Grafana on server boot
sudo systemctl enable grafana-server.service
find the server IP address
ip addr
Visit IP address of server using port 3000
http://192.168.1.x:3000
Default username and password is admin/admin
Prometheus Configuration
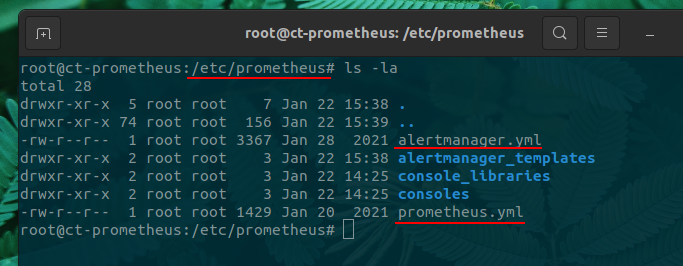
Prometheus configuration file is located under /etc/prometheus/ and is called ‘prometheus.yml’ and if you have alert manager installed that will have its own YAML configuration file called ‘alertmanager.yml’ as shown in the figure below.
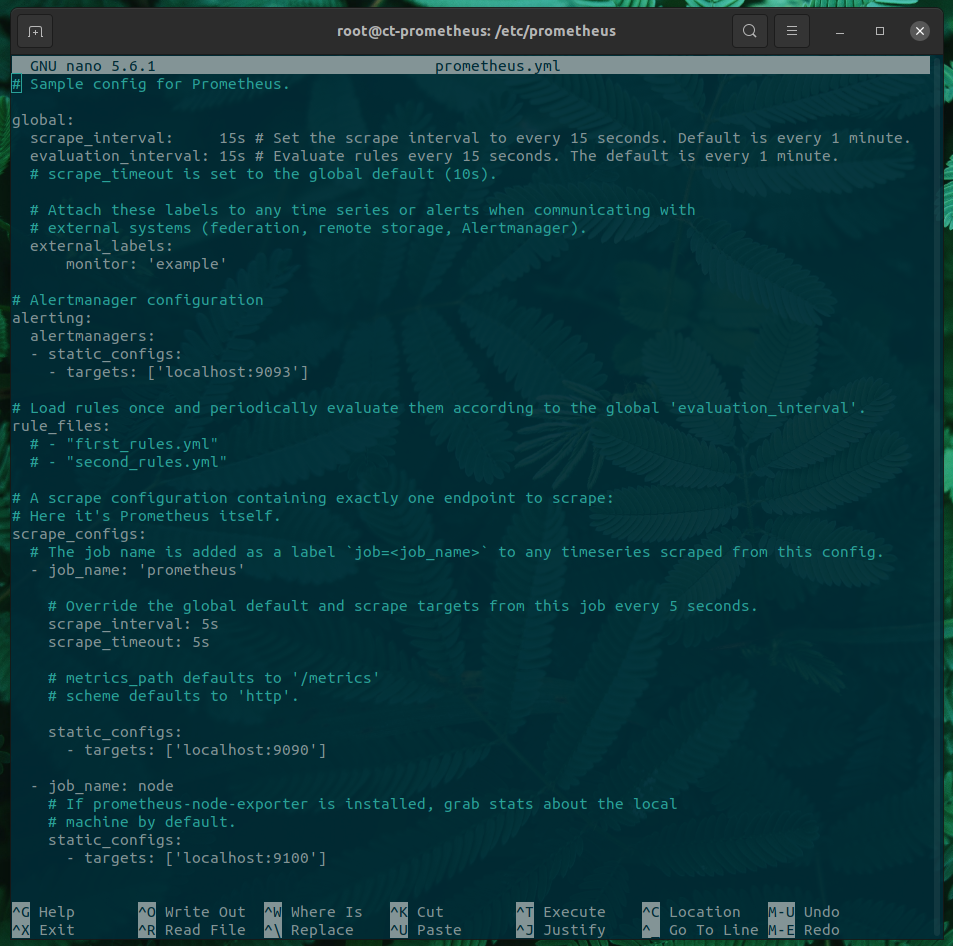
The ‘prometheus.yml’ comes with a sample configuration, as shown in the figure below.
It is comprised of four sections
- global - controls Prometheus server’s global configuration.
- “scrape_interval” controls how often targets will be scraped.
- “evaluation_interval” controls how often rules are evaluated.
- alerting - configuration used by Alert Manager if installed.
- rule_files - used to specify the location of rules.
- scrape_configs - controls what Prometheus monitors
Monitoring another node
I will be deploying the Node-Exporter container on another system using Docker and Portainer. Once deployed metrics are available at the following address.
http://192.168.1.x:9100/metrics
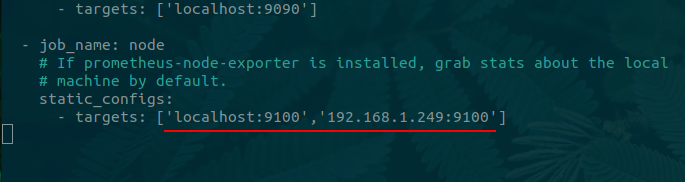
Now we can edit our Prometheus server scrape config to start monitoring this Exporter. First edit the Prometheus YAML configuration file.
sudo nano /etc/prometheus/prometheus.yml
Then add the following within the existing job_name section, use the server host name or IP address.
- job_name: node
  static_configs:
    - targets: ['localhost:9100','192.168.1.x:9100']
Lastly restart the Prometheus service.
sudo systemctl restart prometheus
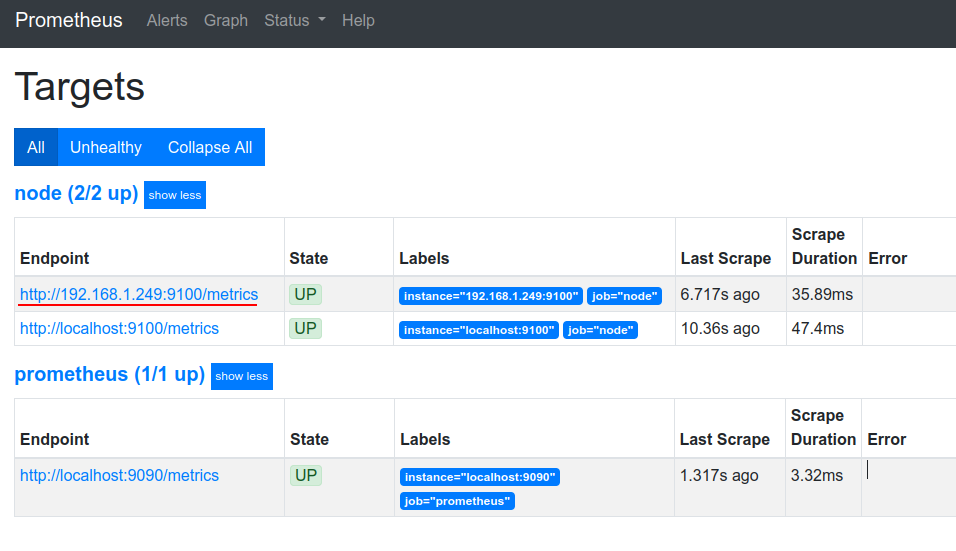
Now then we visit the WebUI and navigate to Status > Targets, the new node should display and report a status of “UP”, as shown in the figure below.
Queries and Graphing
Prometheus uses the language PromQL to write query expressions. I have a crude demonstration showing how to extract usable data.
First navigate to Graph. Using the drop down menu, right of the execute button or start typing enter the following.
All available metrics are not added immediately, an update needs to occur for them to be added.
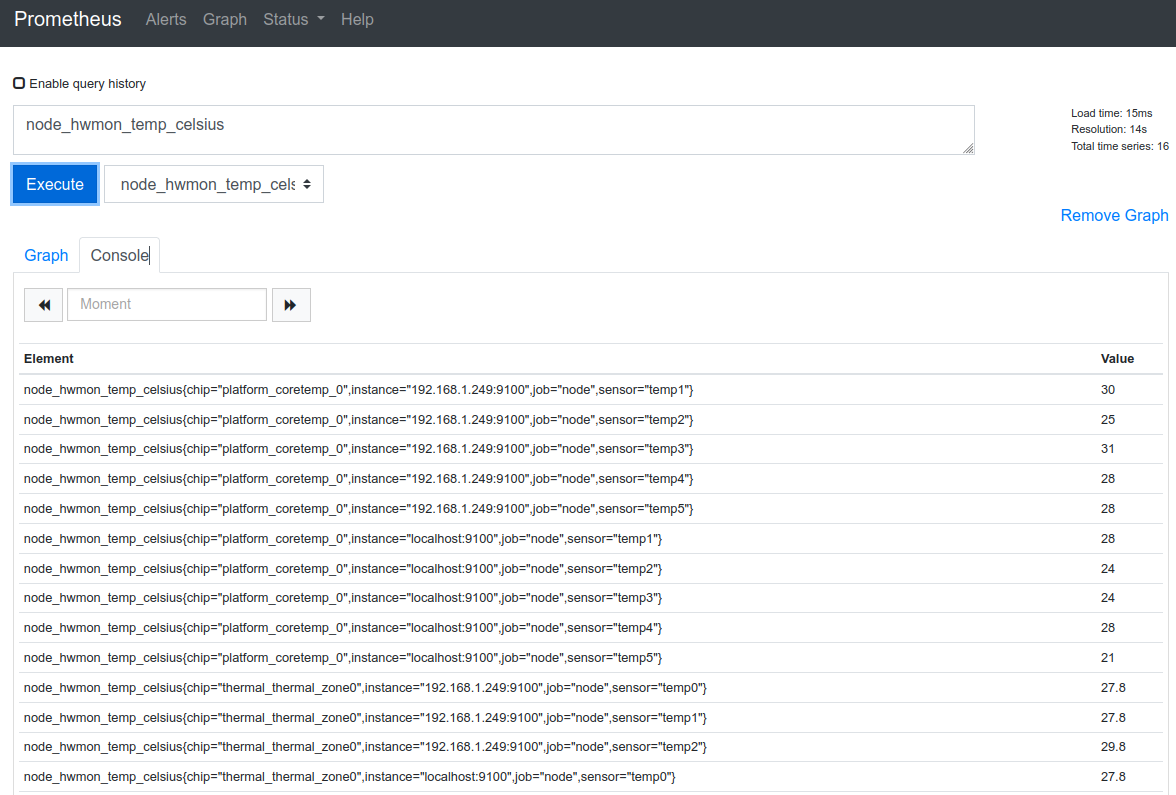
node_hwmon_temp_celsius
This query uses the node-exporter to query for hardware temperatures in Celsius. In the Element pane we can see the returned values.
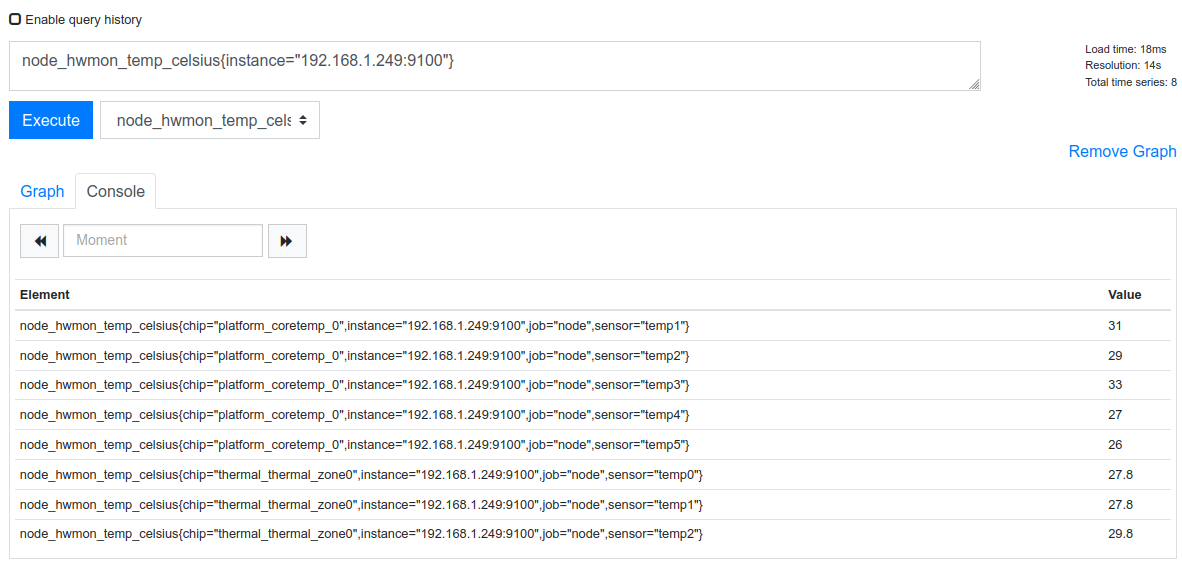
By using curly braces we can filter the results to only the included instance.
node_hwmon_temp_celsius{instance="192.168.1.x:9100"}
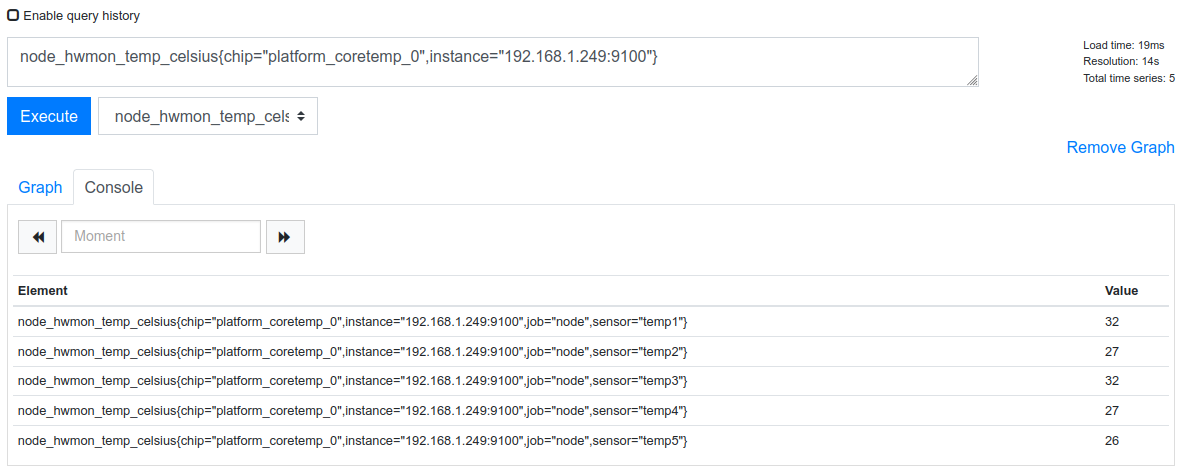
Filters can be stacked and separated using a comma between filters.
node_hwmon_temp_celsius{chip="platform_coretemp_0",instance="192.168.1.x:9100"}
Spend some time playing with metrics and using the operators below to manipulate the data.
PromQL Operators
Arithmetic Operators
- + (add)
- – (subtract)
- * (multiply)
- / (divide)
- % (percentage)
- ^ (exponents)
Comparison Binary Operators
- == (equal to)
- != (does not equal)
- > (greater than)
- < (less than)
- >= (greater than or equal to)
- <= (less than or equal to)
Aggregation Operators
- sum
- avg
- min
- max
- group
- count
- count_values
- topk
- bottomk
- quantile
- stddev
- stdvar
Grafana Configuration
The Grafana dashboard is available using port 3000 by default.
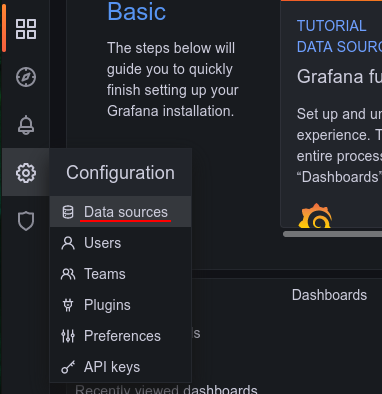
The first step in Grafana is to add our Prometheus data source. Navigate to Configuration > Data sources.
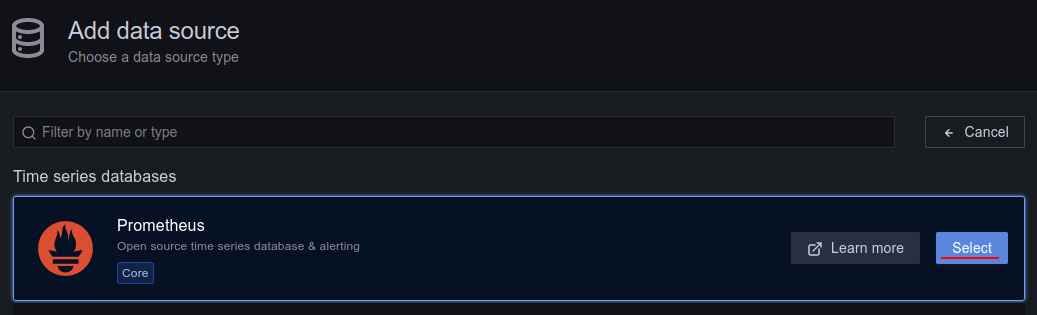
As no data sources have been configured there will be a big “Add data source” button, click that.
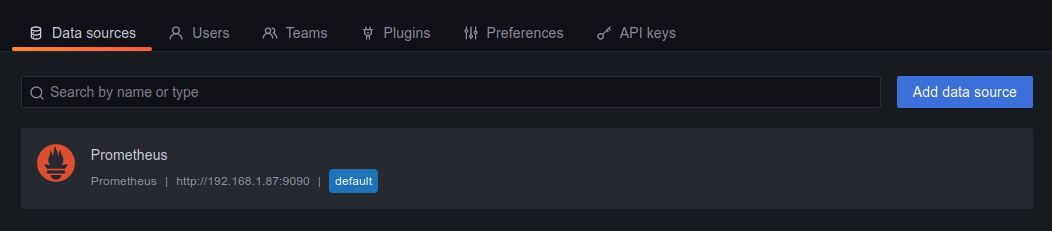
Now select “Prometheus” from the available sources. The only information we need to provide in this demonstration is the URL of our Prometheus server, including the port.
Add and test the connection.
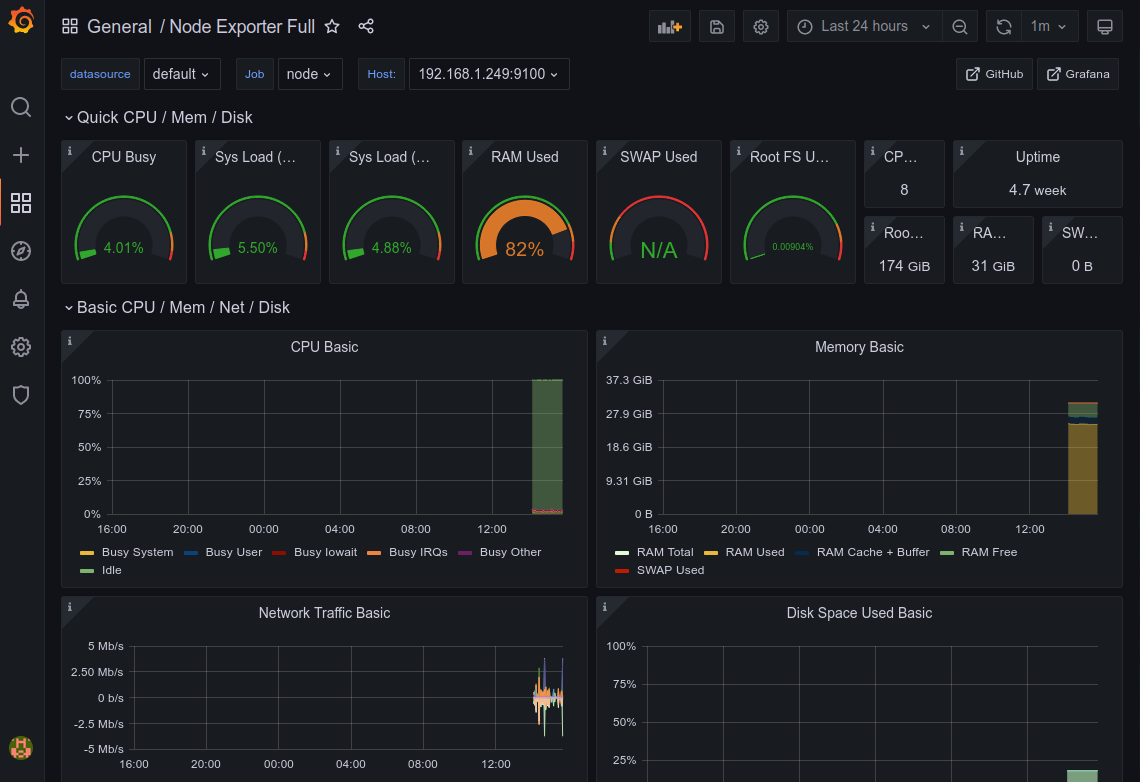
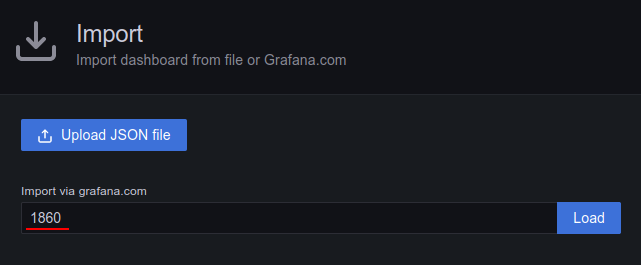
Now we can start to create our own dashboards or import one. In this demonstration I will be importing the Node Exporter Full (id: 1860) dashboard.
Grafana Dashboards are available at https://grafana.com/grafana/dashboards/.
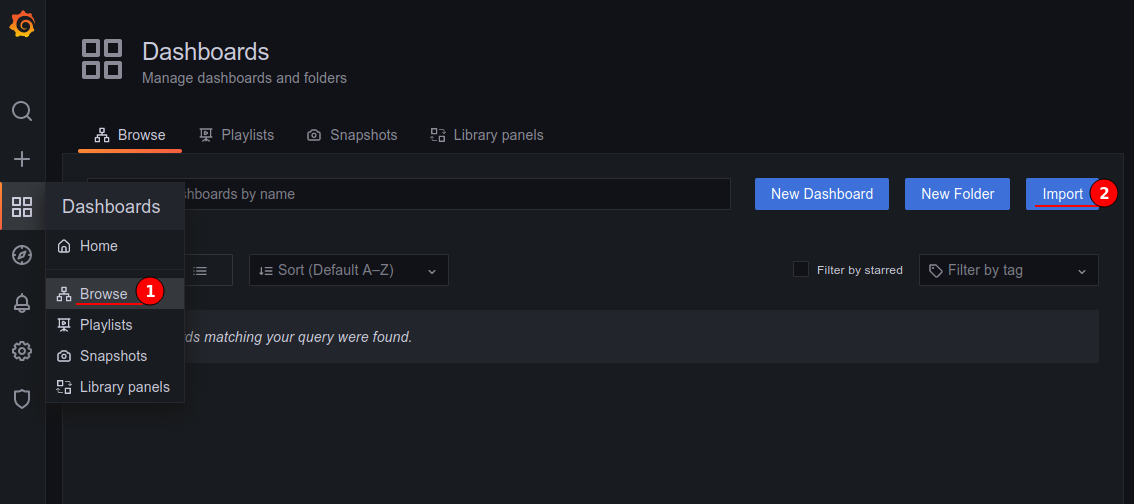
Navigate to Dashboards > Browse and click Import.
Either enter the full URL of the dashboard or the ID number and then click Load.
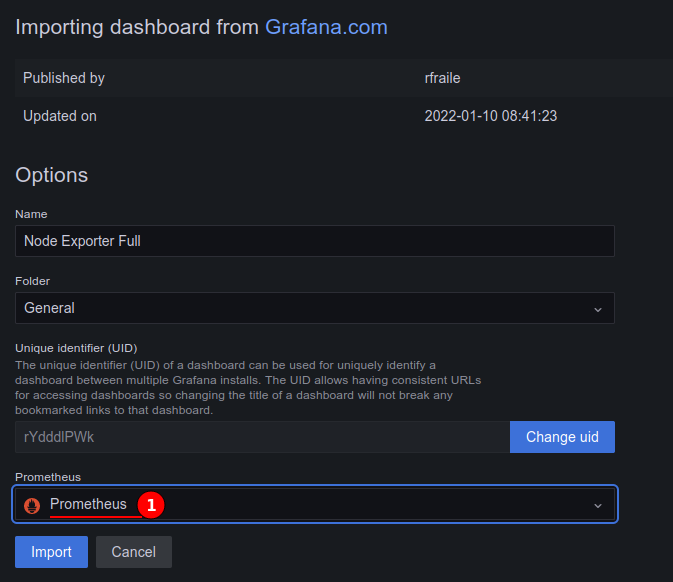
Now we can set a dashboard name and set its folder, I will be leaving this as default values in this demonstration.
Set the Prometheus server from the drop down menu, then click Import to complete.
If successful you will now have a dashboard displaying all the node-exporter metrics collected by Prometheus.